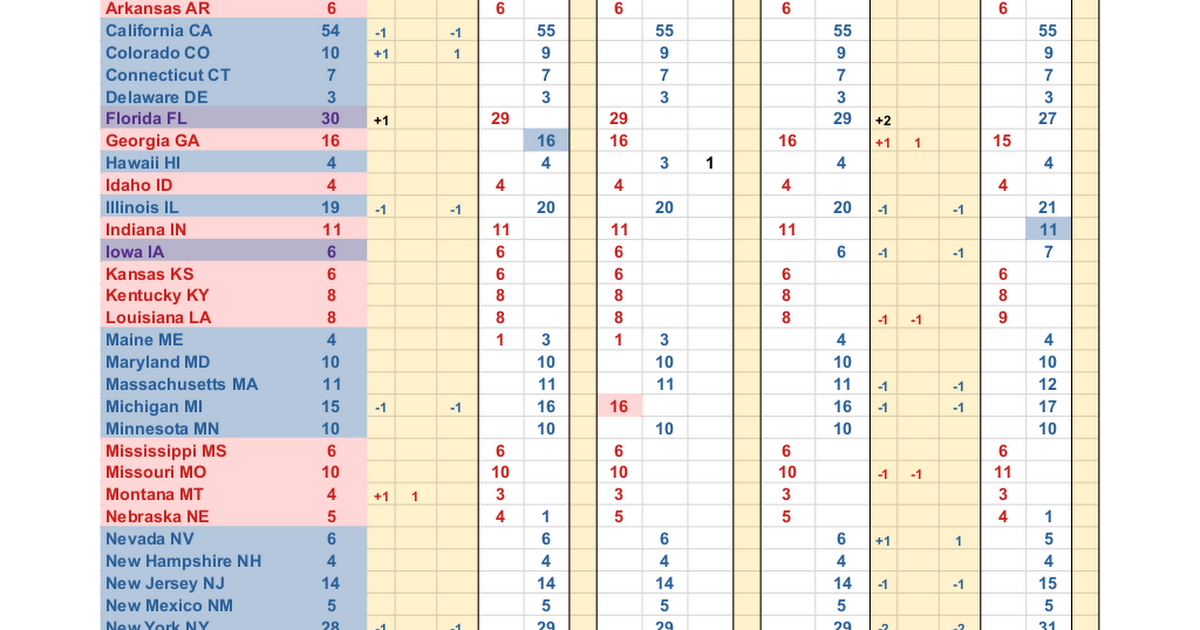
I don't want to dox anyone or myself. Is this a google issue or did I link it wrong?
Assuming only red states have low population and grows faster is weird, but might be plausible. I could look into historical birth rates of each state, or population changes, comparing them to each other to see if the trends make sense. I assumed (or didn't think of) there wouldn't be bias growth rates based on state affiliation (red or blue). My first thought was gerrymandering and could it cause this bias. Either way, I didn't think about population growth having an inherent bias in this.
I was referencing that website, it kinda lines up around the time the parties switched. The party switch could be another result or part of the cause of that inflection point. I realized there could be connection when I was trying to figure out when the parties switched, but I don't know enough about that history.
I forgot to add: In determining if the state was red or blue at a change point, I looked at the 4 prior election results, and 2 aft election results, 6 total to determine how red, blue, or tied purple it was for that time. It's the only fudge factor that could be modified because it's just a guess, but I think the trend will remain even if you modify this (Ex: 3 prior, 1 aft, 2 prior, 1 Aft, etc.)
After noticing the electoral votes changed for this election from the last in 2020, I counted the change in differences of republican states and democratic states, ignoring the swing states. I noticed republican states gained more votes this time than last, and democratic states lost votes, overall giving republicans more electoral votes for this election. Then I kept on going all the way back to almost the civil war. To me, it seems the electoral college has been favoring red states from 1968 to present time. I want to post this somewhere to get feedback if there is a legit trend (red/right leaning) or I have missed something or anything else.
I tried to color the sheets so they are not too hard to read and understand. I also color coded conservative party as red, and liberal party as blue. There was a party shift between 1960 and 1980, probably having 1971 as the inflection point (WTF happened in 1971?). It was interesting to see some states stay mostly their colors from the remnants of the civil war to present day. You should be able to download the document, if you want.
Also, should I also send this to my representative or would that be pointless, or fruitless?
He showed up on Epstein's list when it first came out.
That's a death knell if he did. Bernie said the same thing at the end of this interview: https://www.msnbc.com/msnbc/amp/rcna161541
Feels like no one wants a democracy and care about superficial things only. This country is doomed.
After weeks of republican pressure... Who the fuck is running now? Only fucking trump.
Why?! Trump wins and everything is lost... I hate this.
These are the people who denied covid until it was too late.
I bet these "democrats" are just republicans in hiding.
What happens when he starts saying insane and violent things again on stream?
I wonder how long non-white, non-christian, non-striaght people will realize that they are in the hate group lead by trump, a person that has Hitler like attributes.
For him or for us?
Then don't post them, post things you think others want to see, and propagate relevant information that might be new or important. One is enough for one topic.
I had to block that one account that posted most of them, very sus to me.
They are probably pushing it.
If you are voting the opposite of the norm in your area, you are making a bigger impact than the reverse of the situation. Go by county and try to flip yours to blue. If it happens to flip, your vote counts 100%, otherwise you have at least tried and voted. Here is some links to check 2020 results by town or county.
https://www.nytimes.com/interactive/2021/upshot/2020-election-map.html
Need a reference for this, as I haven't seen or heard this.
